The Genomic Data Commons at the Ten-Year Mark
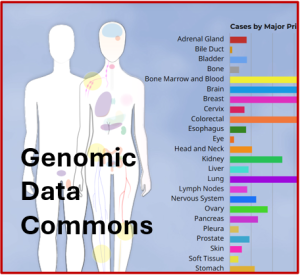
In March 2026, the Genomic Data Commons (GDC) reached a major milestone: 233,000 unique visitors in a single month. Launched in 2016, the GDC was established to harmonize genomic data from several NCI-funded projects, including The Cancer Genome Atlas (TCGA), one of the largest collaborations of its time. Today, researchers worldwide rely on the GDC for access to more than 10 petabytes of data across 91 project datasets.
As a measure of its influence, the GDC has been referenced with thousands of citations in various publications. Each of the project datasets that the GDC hosts and disseminates has also had its own influence, with, for example, more than 11,000 citations for the first (2012) TCGA breast cancer publication. Beyond citations though, the true impact to the cancer research community is immeasurable, through serving gold standard molecular profiling data for continued worldwide clinical discovery, computational method development, and education.
As David Sturgill, PhD, Project Officer, Office of Cancer Genomics (OCG), Division of Cancer Biology (DCB), notes:
Hundreds of thousands of users come to the GDC for the GDC’s growing collection of datasets, including the TCGA, as well as the exploration and analytical tools available through the platform.
At the ten-year mark, the GDC continues to add to its impressive collection of data and has launched several impressive analytical tools in collaboration with the research community.
New Data
Some of the newest data on the GDC platform comes from the Childhood Cancer Data Initiative (CCDI). Released in October 2025, within only a few months (in January 2026), this pediatric cancer dataset became the second most-accessed dataset on the platform, after the TCGA breast cancer project.
Additional new datasets are from a variety of programs including: the Adjuvant Lung Cancer Enrichment Marker Identification and Sequencing Trial (ALCHEMIST), the Center for Cancer Genomics (CCG) Cancers of Unknown Primary Project (CUPP), and the Refractory Cancers (RC) Peripheral T-Cell Lymphoma (PTCL) study, as well as Whole Genome Sequencing (WGS) and RNA-Seq data for ovarian cancer from the Applied Proteogenomics Organizational Learning and Outcomes (APOLLO) network.
Learn more about all new datasets in the GDC Data Release Notes.
Data Analysis
Given the scale of data available through the GDC, many users rely on tools available within its platform. Researchers can build a custom cohort and use gene- and variant-level analysis tools available in the GDC Data Portal Analysis Center to analyze data within the cohort or download harmonized data to work in a local environment.
The Correlation Plot Tool
This tool provides a framework for correlating GDC’s molecular information (mutations, copy number variation, gene expression) with patient clinical and survival data, helping to bridge molecular data and patient outcomes. It enables researchers to compare tumor genomic features with clinical variables such as survival and treatment.
Previously, connecting genomic changes to clinical outcomes required multiple complex analyses. The Correlation Plot Tool simplifies this process by integrating these data types and enabling exploration across large patient cohorts.
Researchers can now investigate questions such as:
- Do patients with mutations in a gene or copy number oss have different survival outcomes than those without?
- Are certain copy number variations and gene expression changes associated with clinical characteristics such as age, stage, or tumor size?
The tool generates visualizations and statistical measures to help identify meaningful patterns. By linking molecular variation with clinical outcomes, it supports the discovery of potential disease drivers, therapeutic targets, and predictive biomarkers, all through an accessible, interactive interface. Documentation about the Correlation Plot tool is available through the GDC portal.
Whole Genome Sequencing Tools
The GDC is expanding its support for Whole Genome Sequencing (WGS), aiming to match the maturity of its Whole Exome Sequencing (WXS) capabilities. WGS presents additional challenges to analysis due to the larger data volume and broader range of detectable mutation types. Find full notes on this work in the DNA-Seq: Whole Genome Sequencing Variant Calling section of the GDC documentation.
Over the last year, the GDC has added several WGS-specific workflows:
- Strelka2: Uses novel statistical models to detect variants that other tools may miss
- SvABA and Manta: Identify structural variants such as large rearrangements, insertions, and deletions, in addition to simple somatic mutations
- Tumor Mutational Burden (TMB) and Mutational Signature workflows
The long-term goal is to integrate results from these distinct tools into a unified WGS Ensemble Mutation Annotation Format (MAF) file. By combining outputs, this new MAF file increases confidence in detected mutations and supports large-scale discovery across vast datasets.
Recent data releases reflect progress in growing the GDC’s WGS research capabilities. Data Release 42 included more than 8,000 new WGS variant calls, and Release 43 expanded WGS variant data for TCGA and other programs
 Integration with the Imaging Data Commons Viewer Tool
In collaboration with the Imaging Data Commons (IDC), the GDC recently (April 2026) introduced the IDC Image Viewer Tool within its Analysis Center, providing integrated image-viewing capabilities to users. Researchers can now view both histopathology images (tissue slides) and radiology images (such as MRIs and CT scans) for cases within their cohort. The IDC Image Viewer Tool links to IDC image visualization tools, including:
- The SliM Viewer for pathology images
- The Open Health Imaging Foundation (OHIF) Viewer for radiology images
Researchers can build cohorts and explore cases with both genomic and imaging data for participants in studies that include both data types. All images in the IDC are open access, and datasets that support this integrated search include The Cancer Genome Atlas (TCGA), the Clinical Proteomic Tumor Analysis Consortium (CPTAC), and the Cancer Genome Characterization Initiative’s Burkitt Lymphoma Genomic Sequencing Project (CGC-BLGSP). Documentation about the IDC Image Viewer can be found on the GDC portal.
A webinar on this new tool will be held September 9, 2026: Explore Cancer Imaging and Genomics with the New GDC Imaging Data Commons (IDC) Image Viewer Tool and IDC Viewers.
Additional documentation is available:
GDC IN THE AI ERA
GDC has positioned itself as a foundational resource for AI-driven research. Its large-scale, harmonized datasets, spanning genomic, clinical, and imaging data, are standardized and quality-controlled, making them well-suited for training machine learning models.
Because all GDC data is processed through consistent pipelines, AI models applied to these datasets are more likely to detect true biological signals rather than bias introduced by inconsistent processing. This supports exploration and analysis ranging from tumor classification to survival prediction.
Learn more about the GDC and AI.
As David Sturgill concludes:
The GDC was always designed to grow and improve. The idea has always been that the GDC should create and/or share data, research methods, and tools as they are developed. Adding the Image Viewer, the new Correlation Plot tool, and building the WGS Ensemble MAF do exactly that. The GDC is evolving with input from the research community to support research that promises to inform earlier, more precise diagnoses and treatments.